Becoming A Peak Performance Trader Teleconference MP3 Download
� How your beliefs about yourself control your performance as a trader.
� How mental states shape your trading.
� The Ten Tasks Model -- what all good traders do.
� Understanding how you sabotage yourself.
� Ways to overcome self-sabotage.
� Question and Answer session.
Tharp�s Thoughts
Market Update for February 27, 2006
1-2-3 Model Still in Red Light Mode
By
Van K. Tharp
Look for these monthly updates on the first issue of each month. This allows us to get the closing month data. In these updates, we�ll be covering each of the major models mentioned in the Safe Strategies book: 1) the 1-2-3 stock market model; 2) the five week status on each of the major stock U.S. stock market indices; 3) our new four star inflation-deflation model; and we�ll be 4) tracking the dollar.
Part I: Market Commentary.
My gut tells me we could be in for a major correction in the stock market in the very near future. Although the S&P 500 is up about 3% for the first four weeks of the year, something seems very out of place for me. I don�t know quite what it is, but I�m very suspicious of what�s going on. And as I reveal what the market is saying to me about the big picture this month, perhaps you�ll understand where my uneasiness is coming from.
Many of you might not believe we�re in a secular bear market. But, you could have gotten a better return from a six month treasury bill in 2004 than you could have gotten from exposing yourself to a lot more volatility in the stock market. Hopefully that�s enough to catch your attention.
Part II: The 1-2-3 Stock Market Model IS IN RED LIGHT MODE.
The Federal Reserve has now increased interest rates 15 times since it began doing so in 2004. And the �word� seems to be that we are due for at least two more interest rate increases. We are also starting to see an inverted yield curve, which usually predicts a recession. So is this going to be a good year to be in the stock market? I very much doubt it. However, on a week to week basis, I let the stock market tell me what to do. So what is the stock market saying?
Let�s look at what the market has done over the last five weeks and compare that with where the averages were December 31st last year. This is given in the next table. Incidentally, this data is calculated by hand based upon last Friday�s close (i.e., February 24th, 2006), so there is always a possibility of human error in our numbers.
Weekly Changes in the
Major Stock Market Indices
|
||||||
|
Date Week
Ending |
DOW
30 |
Change |
SP500 |
Change |
NAS
100 (NDX) |
Change |
|
12/31/04 |
10,783.01 |
|
1211.12 |
|
1621.12 |
|
|
12/30/05 |
10,717.50 |
-0.6 |
1248.29 |
+3.1 |
1645.20 |
+1.5% |
|
2/3/06 |
10,793.62 |
-1.3% |
1264.03 |
-1.5% |
1664.53 |
-2.7% |
|
2/10/06 |
10,919.05 |
1.2% |
1266.99 |
0.2% |
1663.75 |
-0 |
|
2/17/06 |
11,115.32 |
1.8% |
1287.24 |
1.6% |
1675.21 |
+0.7% |
|
2/24/06 |
11,061.85 |
-0.5% |
1289.43 |
0.2% |
1673.50 |
-0.1% |
Efficient stocks. What�s the market telling me in terms of efficiency? Here, the data is very interesting. I now have a proprietary indicator of the entire market � it�s efficiency. What percentage of the stocks that I screen show positive efficiency? What percentage of the stocks show negative efficiency? I�ve only been doing this for about five months so I don�t have much historical data. However, the market continues to be very strong. As of Tuesday night (February 28), 82.1% of the stocks in my database (over 4000 stocks) show positive efficiency, while only 17.9% of the market is negative. Is this a contrarian indicator? I have no idea, but I certainly hope not.
Let me give you an example of what�s showing up as positive and negative. ASA, the South African gold stock, shows up as very efficient with a composite rating above 18. However, look at Chart One of ASA. It has this huge down move followed by a slight retracement. If this were just one example, then I�d say great. But stock after stock after stock on my efficiency screens is showing this retracement over the last two months. What�s going on? Are the big funds getting out of the better stocks and going for the weaker stocks? Is the market telling us something? I have no idea, but this is the pattern I�m observing.
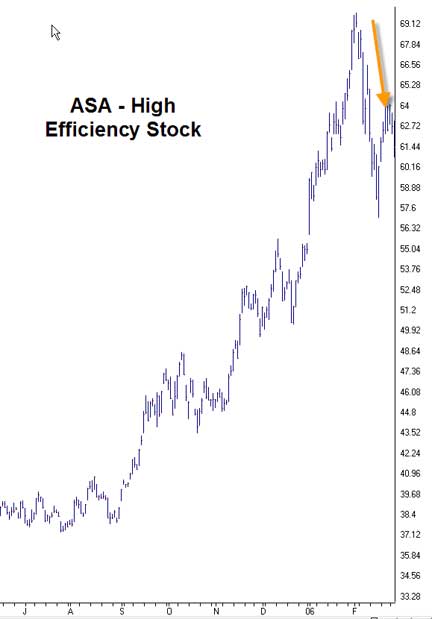
82% of the stock market is showing up with a positive efficiency, but the best stocks are typically not ones I�d be interested in putting my money with � at least not yet.
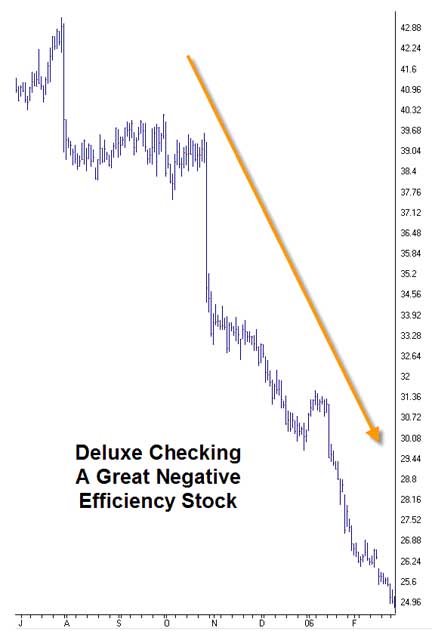
My own trading system requires that I keep the percentage of long and short stocks equal to the market percentages. Thus, I should now be 20% short (and I�m probably a little more than that). However, the negative efficiencies look much better. One of my favorites is Deluxe Checking (DLX). Some of you may remember this from 2001 because in 2001 it was the purest example of a positive efficiency stock that I�d ever seen. But what does it look like today. Well, take a look at Chart Two. It�s a nice straight line going down.
Some of the best looking positive efficiency stocks included: AII, TSU, DBRN, ORA, and PZZA. Incidentally, I pointed out PZZA as a highly efficient stock back in September and it�s gone up a lot since that time.
Some of the best (worst looking) negative efficiency stocks include: COT, DLX, MOVI, and WON. And I think they all look like good short candidates.
Incidentally, since I trade this strategy, I may or may not, have positions in the stocks that I mention. However, these examples are given for educational purposes and you should do your own due diligence if you decide to trade them.
You may have noticed that I�ve mentioned a number of these companies from month to month. Because I have mentioned them, you�ll find that it means that the price has either gone up nicely (in the case of positive efficiency stocks) or gone down nicely (in the case of negative efficiency stocks).
As I�ve said, I try to be short about the same percentage of stocks as the market rates as having negative efficiencies. However, because I don�t like this market, I�m currently about 35% short.
I�d like to conclude this section with a quiz. Look at Chart Three. I�ve attempted to eliminate most of the key identifying information. This stock had an efficiency rating over ten until Tuesday�s performance. You can see the tremendous down day yesterday. Would you want to be long that stock? Or short? Or you don�t know?
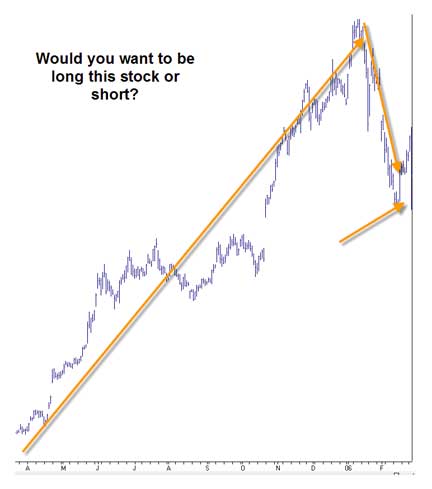
I was short the stock until I got stopped out on Monday at nearly the high point. And then I noticed the huge downturn yesterday. This is why the markets are so interesting. It reminds me a lot of playing poker. You should get out of hands in which it looks like you are beat (i.e., get out at your stop). But when you do fold, the card that had a 5% chance of hitting comes along and gives you a miracle hand that would have won the pot. That�s what this trade seemed like.
When I first developed my proprietary efficiency index in September last year, I had 63 stocks with efficiency ratings above 10 and 7 stocks with ratings above 15. On the negative side, I had 11 stocks with efficiency ratings below minus 10 and 4 with efficiency ratings below minus 15. Let�s compare that with today. As of the close on February 28th, I have 406 stocks with efficiency ratings above 10 and 50 stocks with efficiency ratings above 15. We still have 11 stocks with ratings below minus ten and only two with ratings below minus 15. These ratings are very similar to what I get when I look back at 1999. And remember that by late 2002, I stopped doing my efficiency ratings because I couldn�t find ANY stocks with ratings above 10. Are we experiencing the start of a new bull market or the end of a rally? What do you think?
Part III: Our Four Star Inflation-Deflation Model.
I now strongly believe that we are in an inflationary bear market and that our inflation rate is simply masked by government statistics.
So far our models have been telling us, that inflation/deflation is pretty steady, with a slight inflationary bias and that�s where secular bear markets tend to start.
So what�s our new indicator telling us about inflation?
1) The CRB Index
2) The Basic Materials Sector (XLB)
3) The London Price of Gold and
4) The Financial Sector (XLF)
Since the description of the model is not in any of my books, I�ll continue to give it here.
1) The CRB Index. I believe that the CRB index is the one we have currently that is the least manipulated by the government. But what�s the best way to measure it? For consistency, I plan to give two measurements.
� Is the CRB index higher than it was six months ago? If it is, we are on track for inflation.
� Is the CRB index higher than it was two months ago?
Now there are several ways to monitor these two indices.
� If both differences are higher, we�ll count one star for inflation.
� If the six-month change is higher, but the two-month change is not, then we will only count � star for inflation.
� And if both the two and six month changes are lower, then we�ll be minus one for inflation.
� However, if the six-month change is lower, while the two-month change is higher, then we�ll be minus � star for inflation. Obviously, the two minus scores will point to deflation.
2) The Basic Materials Sector ETF (XLB). In an inflationary environment, basic materials will definitely go up and this sector, to the best of my knowledge, is not manipulated by the government. Thus, we will use this sector to monitor inflation and we�ll use the same measurements use for the CRB. (1) Is the XLB higher than it was six months ago? (2) Is the XLB higher than it was two months ago? These two measurements give us four possible results.
� If both differences are higher, we�ll count one star for inflation.
� If the six-month change is higher, but the two-month change is not, then we will only count � star for inflation.
� And if both the two and six month changes are lower, then we�ll be minus one for inflation.
� However, if the six-month change is lower, while the two-month change is higher, then we�ll be minus � star for inflation. Obviously, the two minus scores will point to deflation.
3) The London PM Gold price at the end of each month. Although the government can manipulate Gold, I still like to look at monthly gold prices. However, to be consistent, we�ll use the same two measurements that we�ve used for the other indices that we are monitoring. (1) Is the price higher than it was six months ago? (2) Is the price higher than it was two months ago? Again, these two measurements give us four possible results.
� If both differences are higher, we�ll count one star for inflation.
� If the six-month change is higher, but the two-month change is not, then we will only count � star for inflation.
� And if both the two and six-month changes are lower, then we�ll be minus one for inflation.
� However, if the six-month change is lower, while the two-month change is higher, then we�ll be minus � star for inflation. Obviously, the two minus scores will point to deflation.
4) The Fourth Measurement we�ll use is related to the Financial Sector of the S&P 500.
The financial sector (XLF) tends to do well when we have deflation and poorly when we have inflation. Martin Pring, in fact, has used an index in which he divides the XLB by the XLF. Since we already use the XLB, we�ll use the XLF by itself as well. Again, we�ll use the change over six months and over two months. However, the four possible outcomes with give us a different interpretation.
� If both differences are higher, we�ll count one star for deflation (i.e., minus one for inflation).
� If the six-month change is higher, but the two-month change is not, then we will only count � star for deflation (i.e., minus � for inflation). And if both the two and six month changes are lower, then we�ll be plus one for inflation.
� However, if the six-month change is lower, while the two-month change is higher, then we�ll be plus � star for inflation. Obviously, the two minus scores will point to strong inflation.
Okay, so now let�s look at the results for the last six months.
|
Date |
CRB |
XLB |
Gold |
XLF |
|
July 29th |
317.78 |
28.64 |
429.00 |
29.93 |
|
September
2nd |
325.35 |
27.44 |
433.25 |
29.44 |
|
September
30th |
333.33 |
27.50 |
466.10 |
29.52 |
|
October
28th |
330.68 |
27.48 |
470.75 |
30.31 |
|
November
30th |
332.49 |
29.67 |
495.85 |
31.87 |
|
December
30th |
347.89 |
30.28 |
513.00 |
31.67 |
|
January
31st |
363.30 |
31.74 |
568.25 |
31.95 |
|
February
28th |
353.27 |
31.06 |
556.00 |
32.63 |
We�ll now look at the two-month and six-month changes during 2005, to see what our readings have been.
|
Date |
CRB2 |
CRB6 |
XLB2 |
XLB6 |
Gold2 |
Gold6 |
XLF2 |
XLF6 |
Total
Score |
|
Jan 06 |
Higher |
Higher |
Higher |
Higher |
Higher |
Higher |
Higher |
Higher |
|
|
|
|
+1 |
|
+1 |
|
+1 |
|
-1 |
+2.0 |
|
Feb 06 |
Higher |
Higher |
Higher |
Higher |
Higher |
Higher |
Higher |
Higher |
|
|
|
|
+1 |
|
+1 |
|
+1 |
|
-1 |
+2.0 |
The results of this model are much more sensitive (I believe) than the model I presented in Safe Strategies for Financial Freedom. For the last two months the model has shown a score of +2. However look at the first three factors. THEY ARE IN HUGE UPTRENDS. The only thing keeping us from a huge inflation signal is the fact that the XLF index is also moving higher.
Part IV: Tracking the Dollar.
The U.S. dollar is beginning to look weak again. Given the weak dollar and the fact that foreign stocks are BOOMING compared with the U.S. stock market, you could lose money even if the U.S. stock market does well this year. Foreign based ETF such as ILF (Latin America with an efficiency rating of 14.54) EEM (Emerging Markets with an efficiency rating of 13.32) EWY (South Korea with a rating of 11.43) and EWZ (Brazil with an efficiency rating of 12.62) have efficiency ratings that are better than the efficiency ratings of most U.S. stocks.
Again, these are not recommendations. I give you this information for educational purposes only so that you can look up the charts and see what you think for yourself. Do your own due diligence before investing.
Look at the next Table, showing the dollar index over the past year.
|
The Dollar Index |
|
|
Month |
Dollar Index |
|
Jan
05 |
81.06 |
|
Feb
05 |
81.81 |
|
Mar
05 |
80.89 |
|
Apr
05 |
82.23 |
|
May
05 |
83.34 |
|
June
05 |
84.95 |
|
July
05 |
85.79 |
|
Aug
05 |
84.26 |
|
Sep
05 |
83.68 |
|
Oct
05 |
85.25 |
|
Nov
05 |
86.69 |
|
Dec
05 |
85.79 |
|
Jan
06 |
84.45 |
|
Feb
06 |
85.26 |
The dollar picture is rather mixed. However, with U.S. interest rates going high, the dollar becomes an attractive place for money to flow (as long as people believe the dollar is safe) because they can get higher rates of returns. For example, the six month t-bill rate is 4.53%, while the S&P 500 was only up 3% last year. Where did you put your money? The most attractive place appears to be foreign stock market ETFs.
What this all means.
Our big picture has not changed. It still suggests a long-term BEAR market. The secular bear began in 2000, but conditions are ripe for one to start even at current levels. Plus debt continues to grow faster than the economy. So something must happen to correct it all.
During this secular bear market we could perhaps look forward to any of the following:
q We could have a decline in the housing market which could cause a crunch for the U.S. consumer who is now spending more than he makes for the first time since the Great Depression of the 1930s.
q The dollar could stop being considered the world�s reserve currency. (What if we have to pay for oil in a gold based currency?).
q The U.S. debt situation could easily unravel (the best way is to inflate it out of existence). Furthermore, our new Federal Reserve Chairman is very concerned about deflation, saying he�ll never let it happen, so the printing presses could really open up.
q In addition, before this secular bear market is over, I�d expect most of the baby boomers to be withdrawing money heavily from the stock market. Social security definitely will not fund their retirement, so they�ll have to rely on the equity in their houses and in their stock market portfolios.
q Lastly, one of the biggest money drains for Americans is health. We spend trillions of dollars on what�s called health care, but health care really means take away these symptoms of my unhealthy lifestyle, which our medical profession attempts to do. However, Americans are now heavier than ever and I predict that more and more dollars with be spent on �health� care in the future until we get smarter (if we do) and start spending that money on having healthier lifestyles instead. My friend Gary Scott has been writing about this major trend that he sees in the future for some time.
And it�s very reasonable that perhaps all of these scenarios could play out in the next 10 years plus. However, who knows how these things will unravel.
This is not about prediction, it�s about looking at conditions influencing the economy and seeing what happens. There will always be good ways to make money if you are willing to work on yourself to get past your fear, greed, and other emotions to just see what is going on in front of you. So let�s continue to watch the market for more signs.
Incidentally, we had over 500 people sign up for the free teleconference that I did on Monday on Peak Performance Trading. And over half of you actually made it to the conference. We had questions from all over the world including Europe and Australia. Notice above that we have the MP3 format ready for download
Until the Market Update at the end of March�.this is Van Tharp.
About Van Tharp: World�renowned trading coach, author and psychologist Dr. Van K Tharp, is widely recognized for his best-selling book Trade Your Way to Financial Fre-edom and his outstanding Peak Performance Home Study program - a highly regarded classic that is suitable for all levels of traders and investors.
March 11-13, 2006
Florida
"Tharp�s disciples swear by the results." -- Forbes Magazine
You�ll leave this investment "Boot Camp" knowing, for the first time in your life, why some people consistently make profits over and over again, while other investors and traders are erratic and unsuccessful.
More importantly, you�ll be able to overcome self-sabotage and develop rock-solid discipline in your performance in the markets.
Short Selling: Evil Practice or Capitalism at Its Finest?
by D. R. Barton, Jr.
Short selling has been in the news quite a bit lately, mainly because another company that is underperforming is trying to blame everyone else for their woes.
Short selling in the stock market is easily the most misunderstood and villainized type of trading. To further their agenda, people call short selling un-American, unpatriotic, etc. Next week we will explore these myths about short selling.
Like most traders, I can�t imagine playing only one side of the game and only buying on expected strength while never selling short on expected. Just to get everyone up to speed, today we�ll look at a brief overview of short selling.
A Brief Primer on Short Selling
Conceptually, a trader or investor buys a stock, hoping for a profit, if their technical or fundamental analysis suggests that the price will go up. If your analysis leads you to believe that the stock will go down, you can sell a stock short in anticipation of a drop in share price.
In terms of logistics, when you sell a stock short, you literally have to borrow those shares from your broker. Here�s how it works:
1.) Megaoverbought.com (Fictitious Symbol: MEGA) shows up as overbought in your analysis work and you think it will drop like a rock. You hit the button on your trading screen to sell short 100 shares of MEGA at $50 per share. (Or you pick up the phone and call in your order � how very 20th Century!)
2.) What really takes place is that you borrow 100 shares of MEGA from your broker who then sells the shares at $50 per share and deposits the $5,000 from the sale into your account.
3.) You now owe your broker 100 shares of MEGA, regardless of the price.
4.) Let�s assume this flying pig of a stock named MEGA drops to $25 just like you thought it would. You buy the shares for $25 each and give them back to your broker. You have pocketed a cool $2,500 in profits (excluding transaction costs).
5.) On the other hand, if MEGA had kept soaring higher, say to $75 per share, you would still buy the shares and return them to your broker, except that now you�d have a loss of $2,500.
Next week we�ll take on some of the myths that surround short selling such as �unlimited risk�, �being unpatriotic�, etc. Until then
Great Trading!
D. R. Barton
Editors note: Last week's article incorrectly stated that stock picking was a.k.a Passive Investing. The correct wording is: stock picking (a.k.a. active investing) is dying in developed countries.
D. R. Barton, Jr. is the Chief Operating Officer and Risk Manager for the Directional Research and Trading hedge fund group. D. R. has been actively involved in trading, researching, and teaching in the markets since 1986. D. R. has taught extensively in many investment areas including intra-day trading, swing trading, and cutting edge risk management techniques.
His writing credits include co-authoring Safe Strategies for Fin-ancial Fre-edom and co-creator and contributing author on Fin-ancial Fre-edom Through Electronic Day Trading.
Special Reports on Money Management and Expectancy
$79.95 each. Click below to learn more
Downloadable format! Learn More...
Liquid Markets
Author: Gvanto
Does anyone have any guidelines on how to find liquid markets (and measure their liquidity?)
Is this simply the amount of average volume being traded?
(Investopedia dictionary: A market with many bid and ask offers. The market is characterized by high liquidity, low spreads, and low volatility.)
Gerry
Reply To This Message
Re: Liquid Markets
Author: PMK
Gerry,
Liquidity applies to individual instruments not markets, you can say that MSFT is liquid, but it does not make sense to say the NYSE is liquid. Liquidity is a measure of how easy it is to buy or sell a particular instrument at a particular size at a particular point-in-time (i.e how much slippage or price movement you are likely to experience when you enter or exit your trade)
There are several measures of liquidity which are (going from long timeframe to short):
The first 'rough guide' is the one you mentioned and that is average volume over some historical time period.
The next is current volume relevant to your trade time period (e.g. over the last 10 minutes, 1 day, etc).
The next is the number of limit orders currently in the book (level 2 data) and how far spaced apart they are (in price).
The next is the current bid and ask size.
In all cases it is the volume measure proportional to your trade position size that is the relevant factor that will determine how much slippage you could experience. Remember that liquidity goes up and down constantly, so don't enter a position that is 'on the edge' in terms of liquidity,
because if liquidity goes down while you are in the trade you may experience huge slippage when you come to exit.
Hope this helps
Paul King
Reply To This Message
Re: Liquid Markets
Author: Pumpernickel
Stocks and Commodities magazine ( triple w dot traders dot com ) prints a page in every issue, called "Futures Liquidity". For example in the Feb 2006 issue, it is on page 98. It ranks futures markets according to a formula (which is fully disclosed) and provides a table with a histogram of relative liquidity.
In this particular issue, CME Eurodollars was the most liquid contract. It's hard to say which was the least liquid, since several of the more notorious badboys weren't even in the table (Cheese, Propane, Pork Bellies). The last market IN THE TABLE, was CME Nikkei. However they didn't provide data for its big brother Nikkei contract traded in Singapore and made (in)famous by Nick
Leeson.
Special Reports By Van Tharp
Click below to read page one of each report, or to order.
Do Not Reply to this email using the reply button as the email address is not monitored, your email will not be seen. Please click this link contact us: [email protected]
The Van Tharp Institute does not support spamming in any way, shape or form. This is a subscription based newsletter.
If you no longer wish to subscribe, Unsubscribe Here
Or, paste this address in your browser: http://www.iitm.com/remove_update.htm
Copyright 2006 the International Institute of Trading Mastery, Inc.
